 Catalogue PIGMA
maritime transport
Type of resources
Available actions
Topics
Keywords
Contact for the resource
Provided by
Years
Formats
Representation types
Update frequencies
Resolution
-
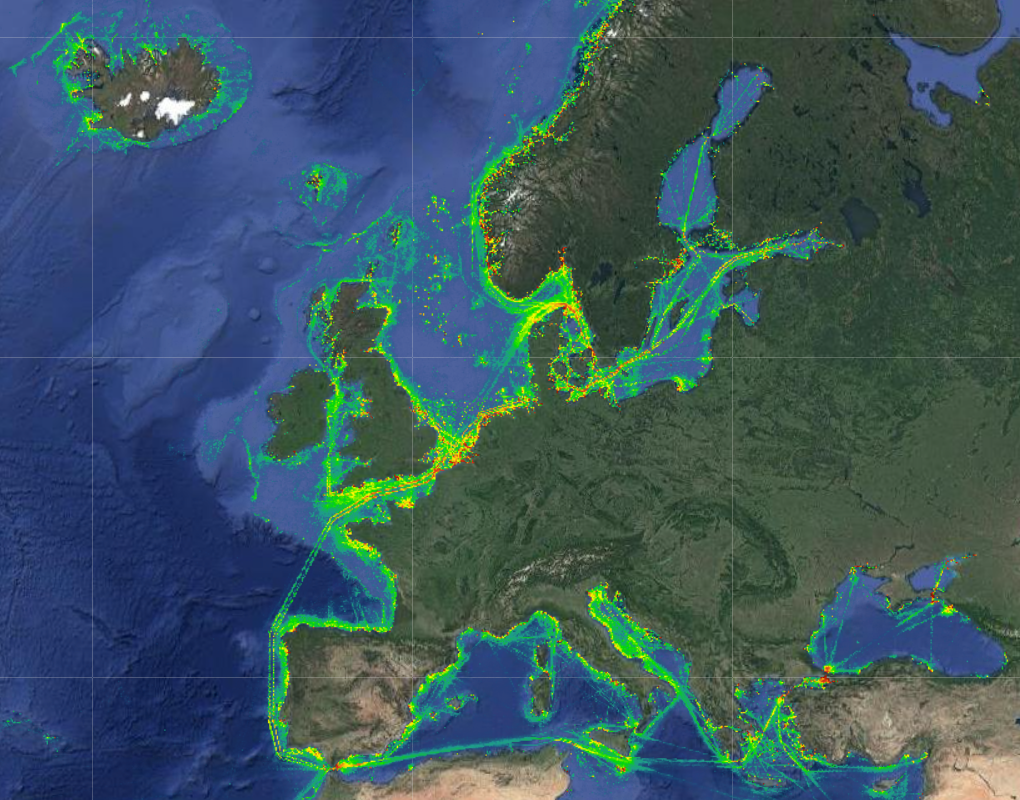
The Vessel Density maps in the EU were created in 2019 by Cogea for the European Marine Observation and Data Network (EMODnet). The dataset is updated every year and is available for viewing and download on EMODnet Human Activities web portal (www.emodnet-humanactivities.eu). The maps are based on AIS data yearly purchased from Collecte Localisation Satellites (CLS) and ORBCOMM. The maps, GeoTIFF format, show shipping density in 1x1km cells of a grid covering all EU waters and some neighbouring areas. Density is expressed as hours per square kilometre per month. The following ship types are available:0 Other, 1 Fishing, 2 Service, 3 Dredging or underwater ops, 4 Sailing, 5 Pleasure Craft, 6 High speed craft, 7 Tug and towing, 8 Passenger, 9 Cargo, 10 Tanker, 11 Military and Law Enforcement, 12 Unknown and All ship types. Data are available by month of year. Yearly averages are also available.
-
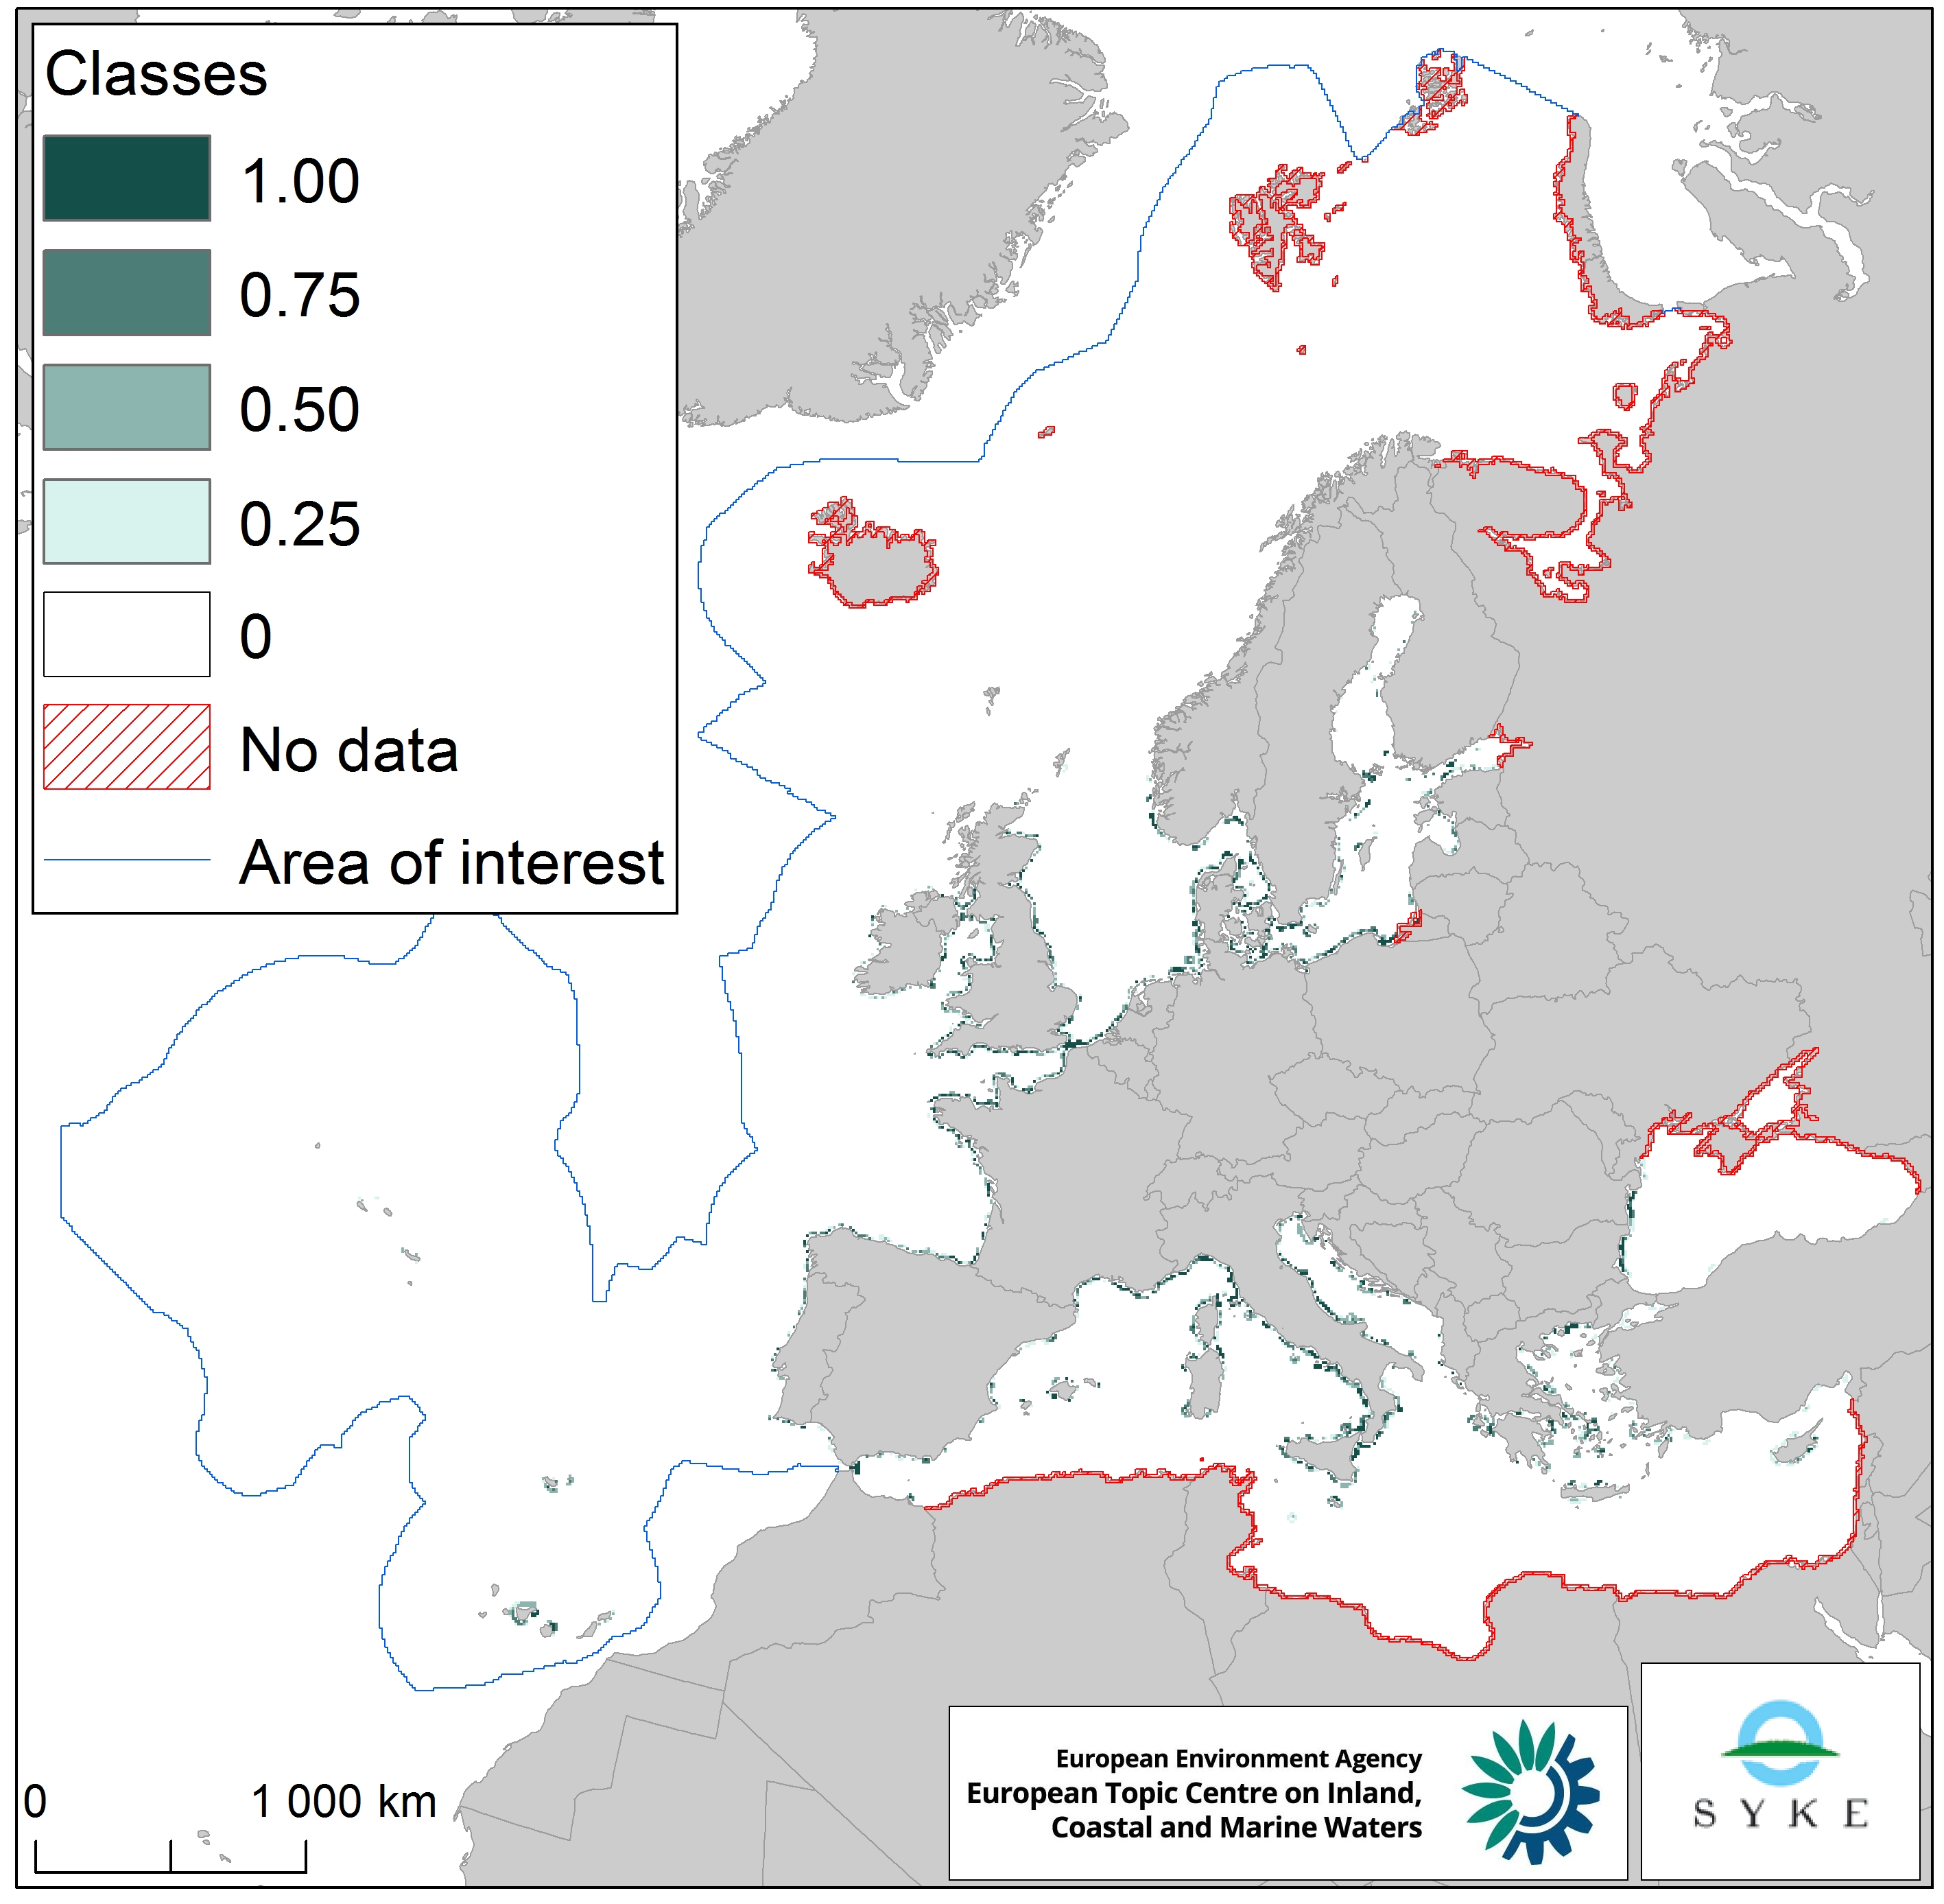
This raster dataset represents the input of microbial pathogens along the European coastlines. The pressure layer was created using three different datasets rasterized using the EEA 10 km grid: urban agglomerations reported under the Urban Waste Water Treatment Directive (2017), EMODnet dataset of ports lying on the sea coast together with passenger information (annual average 2006-2016) and Intestinal enterococci and Escherichia coli data at bathing sites as measured under the Bathing Water Directive reporting obligation (average 2008-2016). All three datasets were then classified into four classes, aggregated and classified again (quantile classes between 0 and 1, with the latter being the highest pathogen pressure). This dataset has been prepared for the calculation of the combined effect index, produced for the ETC/ICM Report 4/2019 "Multiple pressures and their combined effects in Europe's seas" available on: https://www.eionet.europa.eu/etcs/etc-icm/etc-icm-report-4-2019-multiple-pressures-and-their-combined-effects-in-europes-seas-1.